How To Plot A Trading Graph With Bitquery API and Javascript

Hi, i'm a blockchain developer, software developer, technical writer with extensive experience in a variety of front-end and back-end technologies, frameworks/libraries, databases and best code practices as well as an understanding of the fundamental design ideas that underpin scalable solutions.
Introduction
In the fast-paced world of cryptocurrency trading, having access to real-time data and analytics is crucial for making informed decisions. Bitquery is a powerful data analytics platform that provides developers with access to a vast amount of blockchain data through its API. With Bitquery's API, developers can easily retrieve and manipulate data from various blockchain networks, including Bitcoin, Ethereum, Binance Smart Chain, and more. One way to utilize this data is by building trading graphs, which can provide valuable insights into market trends and help traders make better decisions. In this article, we will explore how to build a trading graph using Bitquery's API and JavaScript. We will cover the steps required to retrieve and parse data from Bitquery's API and how to use a popular graphing library to display the data in a visually appealing and informatively. This article will walk you through the steps to plot a graph using Bitquery's API and Javascript.
That being said, before we begin developing the trading graph, it is imperative to understand what an API is.
What is an API?
API, also known as application program interface, is a medium through which software applications send, request, and receive digital information between themselves. Think of API as a waiter in a pizza shop who takes orders from the customer, takes them to the kitchen, and returns the ordered pizza to the customer.
What is Bitquery API?
Bitquery is a platform that allows users to access information stored on various public blockchains, such as Bitcoin, Ethereum, and Binance Chain, through a single API. It provides a unified interface to query the data stored on different blockchains, enabling developers to access and process this information more efficiently. Bitquery helps to streamline the process of accessing blockchain data, making it easier for developers to build applications that require this data. With Bitquery's API, developers can easily access and query blockchain data in real-time.
Additionally, bitquery provides insightful blockchain GRAPHQL APIs for use from over 30 blockchain networks which makes them one of the few to provide such services.
Bitquery also provides a user-friendly GRAPHQL playground for users willing to learn how to build query schemas for use. Above all, Bitquery also provides a great support team for users having issues with their products.
Learn more about bitquery here
The steps to start developing with bitquery API are as follows:
Step 1: Sign up for a Bitquery account
Before you can start using Bitquery's API, you need to sign up for an account on their website. The process is straightforward, and you only need to provide your email address and choose a password.
Step 2: Get an API key
Once you have created an account, you will need to generate an API key to access Bitquery's API. To do this, log in to your account, and click on the "API Keys" tab in the left-hand menu. Click on the "Generate New Key" button, and you will be presented with your API key.
Step 3: Choose a blockchain network
Bitquery supports several blockchain networks, including Bitcoin, Ethereum, Binance Smart Chain, and many more. Choose the network you want to work with and take note of its API endpoint.
Step 4: Build your query
Bitquery's API uses GraphQL, a powerful query language that allows you to retrieve data in a structured format. To build your query, you can use Bitquery's GraphiQL interface, which provides a user-friendly way to construct your queries.
For example, if you want to retrieve the price of a particular token on the Ethereum network, you can use the following query:
{
  ethereum(network: bsc) {
    dexTrades(
      baseCurrency: {is: "0x0e09fabb73bd3ade0a17ecc321fd13a19e81ce82"}
      quoteCurrency: {is: "0x55d398326f99059ff775485246999027b3197955"}
      options: {desc: ["block.height", "transaction.index"], limit: 1}
    ) {
      block {
        height
        timestamp {
          time(format: "%Y-%m-%d %H:%M:%S")
        }
      }
      transaction {
        index
      }
      baseCurrency {
        symbol
      }
      quoteCurrency {
        symbol
      }
      quotePrice
    }
  }
}
This query retrieves the price of CAKE in USDT from the pancake swap network.
Plotting Graph
Now that we have an idea of how to use the bitquery API to retrieve data from a specific blockchain network, we can also use this data to plot a graph. We will use a javascript graph library called lightweight chart to demonstrate this.
The first thing to do is to create a directory with the command below:
mkdir trade_graph
Change into the newly created object with:
cd trade_graph
Now, create two files namely, index.html and index.js respectively.
Graph Code
I will break the code to be added to the index.js file into three sections:
Create Query
Connect to Bitquery Endpoint
Create the graph with the fetched data
Create Query
const QUERY = `
{
  ethereum(network: ethereum) {
    dexTrades(
      options: {limit: 100, asc: "timeInterval.minute"}
      date: {since: "2021-05-23"}
      exchangeName: {is: "Uniswap"}
      baseCurrency: {is: "0x1f9840a85d5af5bf1d1762f925bdaddc4201f984"}
      quoteCurrency: {is: "0xdAC17F958D2ee523a2206206994597C13D831ec7"}
    ) {
      timeInterval {
        minute(count: 5)
      }
      baseCurrency {
        symbol
        address
      }
      baseAmount
      quoteCurrency {
        symbol
        address
      }
      quoteAmount
      trades: count
      quotePrice
      maximum_price: quotePrice(calculate: maximum)
      minimum_price: quotePrice(calculate: minimum)
      open_price: minimum(of: block, get: quote_price)
      close_price: maximum(of: block, get: quote_price)
    }
  }
}

`;
Connect to Bitquery Endpoint
const endpoint = "https://graphql.bitquery.io/";

// Function which fetches the data from the API
async function fetchData() {
  const response = await fetch(endpoint, {
    method: "POST",
    headers: {
      "Content-Type": "application/json",
      "X-API-KEY": "insert-your-apikey",
    },
    body: JSON.stringify({
      query: QUERY,
    }),
  });

  const data = await response.json();
Create the graph with the fetched data
const chart = LightweightCharts.createChart(document.body, {
    width: 800,
    height: 600,
  });

  const lineSeries = chart.addLineSeries();

  lineSeries.applyOptions({
    color: "#00027A",
    lineWidth: 3,
  });

  chart.applyOptions({
    watermark: {
      color: "#008080",
      visible: true,
      text: "Simple graph of UNI/USDT",
      fontSize: 24,
      horzAlign: "center",
      vertAlign: "center",
    },
  });

  // set data
  lineSeries.setData([
    {
      time: "2021-06-01",
      value: data.data.ethereum.dexTrades[0].maximum_price,
    },
    {
      time: "2021-06-02",
      value: data.data.ethereum.dexTrades[1].maximum_price,
    },
    {
      time: "2021-06-03",
      value: data.data.ethereum.dexTrades[2].maximum_price,
    },
    {
      time: "2021-06-04",
      value: data.data.ethereum.dexTrades[3].maximum_price,
    },
    {
      time: "2021-06-05",
      value: data.data.ethereum.dexTrades[4].maximum_price,
    },
    {
      time: "2021-06-06",
      value: data.data.ethereum.dexTrades[5].maximum_price,
    },
    {
      time: "2021-06-07",
      value: data.data.ethereum.dexTrades[6].maximum_price,
    },
    {
      time: "2021-06-08",
      value: data.data.ethereum.dexTrades[7].maximum_price,
    },
    {
      time: "2021-06-09",
      value: data.data.ethereum.dexTrades[8].maximum_price,
    },
    {
      time: "2021-06-10",
      value: data.data.ethereum.dexTrades[9].maximum_price,
    },
    {
      time: "2021-06-11",
      value: data.data.ethereum.dexTrades[10].maximum_price,
    },
    {
      time: "2021-06-12",
      value: data.data.ethereum.dexTrades[11].maximum_price,
    },
    {
      time: "2021-06-13",
      value: data.data.ethereum.dexTrades[12].maximum_price,
    },
    {
      time: "2021-06-14",
      value: data.data.ethereum.dexTrades[14].maximum_price,
    },
    {
      time: "2021-06-15",
      value: data.data.ethereum.dexTrades[15].maximum_price,
    },
    {
      time: "2021-06-16",
      value: data.data.ethereum.dexTrades[16].maximum_price,
    },
    {
      time: "2021-06-17",
      value: data.data.ethereum.dexTrades[17].maximum_price,
    },
    {
      time: "2021-06-18",
      value: data.data.ethereum.dexTrades[18].maximum_price,
    },
    {
      time: "2021-06-19",
      value: data.data.ethereum.dexTrades[19].maximum_price,
    },
    {
      time: "2021-06-20",
      value: data.data.ethereum.dexTrades[20].maximum_price,
    },
    {
      time: "2021-06-21",
      value: data.data.ethereum.dexTrades[21].maximum_price,
    },
    {
      time: "2021-06-22",
      value: data.data.ethereum.dexTrades[22].maximum_price,
    },
    {
      time: "2021-06-23",
      value: data.data.ethereum.dexTrades[23].maximum_price,
    },
    {
      time: "2021-06-24",
      value: data.data.ethereum.dexTrades[24].maximum_price,
    },
    {
      time: "2021-06-25",
      value: data.data.ethereum.dexTrades[25].maximum_price,
    },
    {
      time: "2021-06-26",
      value: data.data.ethereum.dexTrades[26].maximum_price,
    },
    {
      time: "2021-06-27",
      value: data.data.ethereum.dexTrades[27].maximum_price,
    },
    {
      time: "2021-06-28",
      value: data.data.ethereum.dexTrades[28].maximum_price,
    },
    {
      time: "2021-06-29",
      value: data.data.ethereum.dexTrades[29].maximum_price,
    },
    {
      time: "2021-06-30",
      value: data.data.ethereum.dexTrades[30].maximum_price,
    },
    {
      time: "2021-07-01",
      value: data.data.ethereum.dexTrades[31].maximum_price,
    },
    {
      time: "2021-07-02",
      value: data.data.ethereum.dexTrades[32].maximum_price,
    },
    {
      time: "2021-07-03",
      value: data.data.ethereum.dexTrades[33].maximum_price,
    },
    {
      time: "2021-07-04",
      value: data.data.ethereum.dexTrades[34].maximum_price,
    },
    {
      time: "2021-07-05",
      value: data.data.ethereum.dexTrades[35].maximum_price,
    },
    {
      time: "2021-07-06",
      value: data.data.ethereum.dexTrades[36].maximum_price,
    },
    {
      time: "2021-07-07",
      value: data.data.ethereum.dexTrades[37].maximum_price,
    },
    {
      time: "2021-07-08",
      value: data.data.ethereum.dexTrades[38].maximum_price,
    },
    {
      time: "2021-07-09",
      value: data.data.ethereum.dexTrades[39].maximum_price,
    },
    {
      time: "2021-07-10",
      value: data.data.ethereum.dexTrades[40].maximum_price,
    },
    {
      time: "2021-07-11",
      value: data.data.ethereum.dexTrades[41].maximum_price,
    },
    {
      time: "2021-07-12",
      value: data.data.ethereum.dexTrades[42].maximum_price,
    },
    {
      time: "2021-07-13",
      value: data.data.ethereum.dexTrades[43].maximum_price,
    },
    {
      time: "2021-07-14",
      value: data.data.ethereum.dexTrades[44].maximum_price,
    },
    {
      time: "2021-07-15",
      value: data.data.ethereum.dexTrades[45].maximum_price,
    },
    {
      time: "2021-07-16",
      value: data.data.ethereum.dexTrades[46].maximum_price,
    },
    {
      time: "2021-07-17",
      value: data.data.ethereum.dexTrades[47].maximum_price,
    },
    {
      time: "2021-07-18",
      value: data.data.ethereum.dexTrades[48].maximum_price,
    },
    {
      time: "2021-07-19",
      value: data.data.ethereum.dexTrades[49].maximum_price,
    },
    {
      time: "2021-07-20",
      value: data.data.ethereum.dexTrades[50].maximum_price,
    },
    {
      time: "2021-07-21",
      value: data.data.ethereum.dexTrades[51].maximum_price,
    },
    {
      time: "2021-07-22",
      value: data.data.ethereum.dexTrades[52].maximum_price,
    },
    {
      time: "2021-07-23",
      value: data.data.ethereum.dexTrades[53].maximum_price,
    },
    {
      time: "2021-07-24",
      value: data.data.ethereum.dexTrades[54].maximum_price,
    },
    {
      time: "2021-07-25",
      value: data.data.ethereum.dexTrades[55].maximum_price,
    },
    {
      time: "2021-07-26",
      value: data.data.ethereum.dexTrades[56].maximum_price,
    },
    {
      time: "2021-07-27",
      value: data.data.ethereum.dexTrades[57].maximum_price,
    },
    {
      time: "2021-07-28",
      value: data.data.ethereum.dexTrades[58].maximum_price,
    },
    {
      time: "2021-07-29",
      value: data.data.ethereum.dexTrades[59].maximum_price,
    },
    {
      time: "2021-07-30",
      value: data.data.ethereum.dexTrades[60].maximum_price,
    },
    {
      time: "2021-07-31",
      value: data.data.ethereum.dexTrades[61].maximum_price,
    },
    {
      time: "2021-08-01",
      value: data.data.ethereum.dexTrades[62].maximum_price,
    },
    {
      time: "2021-08-02",
      value: data.data.ethereum.dexTrades[60].maximum_price,
    },
    {
      time: "2021-08-03",
      value: data.data.ethereum.dexTrades[63].maximum_price,
    },
    {
      time: "2021-08-04",
      value: data.data.ethereum.dexTrades[64].maximum_price,
    },
    {
      time: "2021-08-05",
      value: data.data.ethereum.dexTrades[65].maximum_price,
    },
    {
      time: "2021-08-06",
      value: data.data.ethereum.dexTrades[66].maximum_price,
    },
    {
      time: "2021-08-07",
      value: data.data.ethereum.dexTrades[67].maximum_price,
    },
    {
      time: "2021-08-08",
      value: data.data.ethereum.dexTrades[68].maximum_price,
    },
    {
      time: "2021-08-09",
      value: data.data.ethereum.dexTrades[69].maximum_price,
    },
    {
      time: "2021-08-10",
      value: data.data.ethereum.dexTrades[70].maximum_price,
    },
  ]);
}

fetchData();
In the index.html file, copy the below code to display the graph.
<!DOCTYPE html>
<html lang="en">
<head>
<meta charset="utf-8" />
<link
rel="icon"
href="https://test.bitquery.io/wp-content/uploads/2020/08/favicon.png"
/>
<meta name="viewport" content="width=device-width, initial-scale=1" />
<meta name="theme-color" content="#000000" />
<meta
name="description"
content=" TradingView built with Bitquery"
/>
<link
rel="apple-touch-icon"
href="https://test.bitquery.io/wp-content/uploads/2020/08/favicon.png"
/>
<link rel="manifest" href="%PUBLIC_URL%/manifest.json" />
<title>TradingView and Bitquery</title>
<style>
* {
align-items: center;
text-align: center;
font-family: "sanserif";
}
body {
background-color: rgb(156, 152, 186);
position: absolute;
top: 50%;
left: 50%;
transform: translate(-50%, -50%);
}
</style>
</head>
<body>
<h1>Tradingchart with Bitquery API section</h1>
<script src="https://unpkg.com/lightweight-charts/dist/lightweight-charts.standalone.production.js"></script>
<script src="./index.js"></script>
</body>
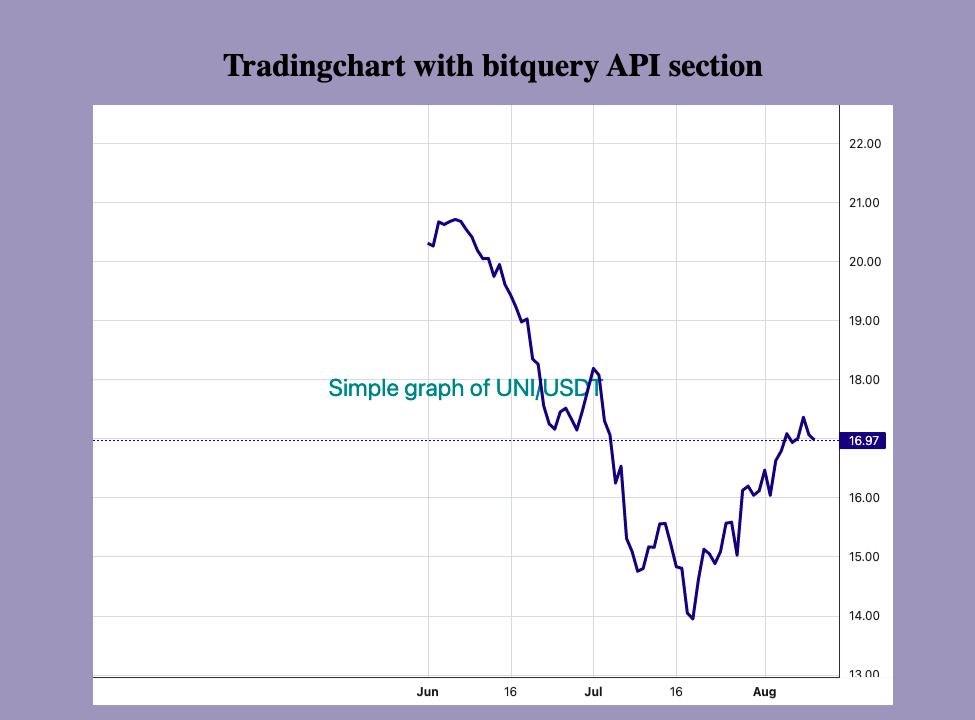
</html>
The above will compute a graph of UNI/USDT.
Conclusion
In this article, we have shown you how to plot a graph using Bitquery's API. By following the steps outlined above, you can retrieve blockchain data in real-time and visualize it on a graph, allowing you to gain valuable insights into blockchain networks. With Bitquery's powerful API and a graphing library of your choice, the possibilities are endless.


